Basic HTML-Version


2
3
4
5
236
TELE-satellite International — The World‘s Largest Digital TV Trade Magazine
— 12-01/2012
— www.TELE-satellite.com
put which creates a composite video
signal of the spectrum display.
We took advantage of that option to
save the video signal on our PC with
the help of a video card, and to extract
spectrum measurements using image
processing software in order to further
work with the data.
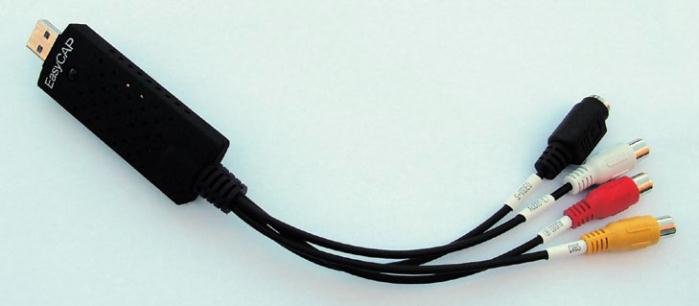
All you need for this is a so-called
video grabber, which is an adapter that
digitises the analog video signal and
creates a file for further software pro-
cessing. In theory, any TV card or USB
adapter should do – USB adapters are
frequently available in a bundle with
video editors to digitise VHS tapes. You
may even want to look for the ‘EasyCap’
adapter on eBay, which we were able to
obtain from Hong Kong for about EUR
5.00 including postage (see image 2).
For our experiment we proceeded
with programming software that con-
verts, analyses and extracts the spec-
trum using a video grabber, so that
data can be displayed as a waterfall
diagram. TELE-satellite readers can
download the software free of charge
(www.TELE-satellite.com/waterfall-for-
8dtek.zip) so that users of any of the
three 8dtek meters can add waterfall
capability to their devices.
Waterfall diagrams can be hugely
useful: After a short adjustment period
we discovered a number of scenarios in
which waterfalls diagrams can be put to
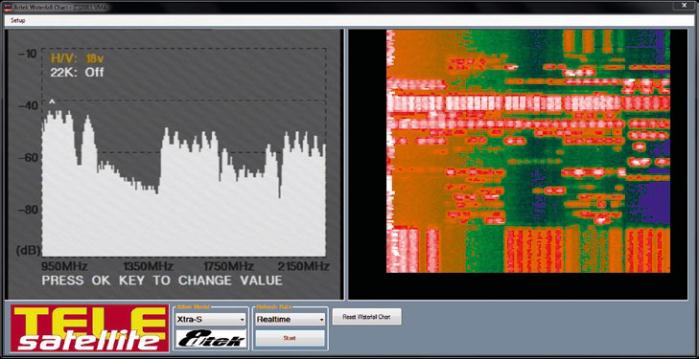
fruitful use. Have a look at image 3, for
example, to find out how our motorised
antenna moves from HIPASAT 30.0W to
INTELSAT12 45.0E. The waterfall dia-
gram shows all passed satellites, which
is an easy way of checking whether all
positions are already stored in the sat-
ellite receiver.
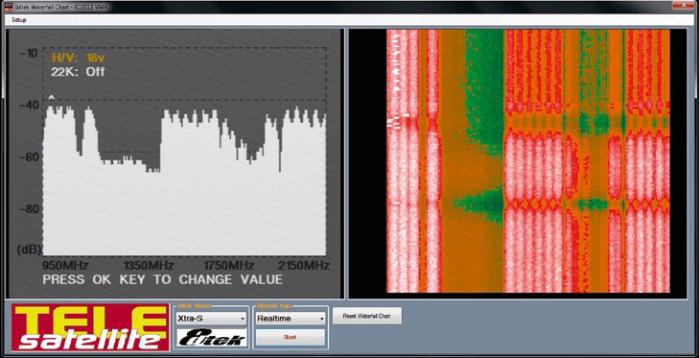
Image 4 shows a rather different ap-
plication for a waterfall diagram. In this
scenario the antenna alignment (HIS-
PASAT 30.0W in our case) is optimised.
While a conventional spectrum display
can be used to perfectly align an an-
tenna using the peak level feature, a
waterfall diagram can achieve the same
result with much less hassle.
Seen from top to bottom the weak
red colours show somewhat mediocre
reception quality of HISPASAT. When
the antenna is moved slightly towards
the East the signal becomes weaker,
which is why the antenna is then ro-
tated in the opposite direction with the
signal becoming stronger, reaching its
peak level and decreasing again. All